Official statistics: Nearly a quarter of UK residents are disabled
Did you know that The Department for Work & Pensions runs a continuous household survey which collects information on a representative sample of private households in the United Kingdom?
It is called the Family Resources Survey and the most recent survey for the financial year 2022 to 2023 contains many eye-watering accredited official statistics.
The sample for 2022-2023 was just over 25,000 households and recorded detailed information on each respondent concerning:
- their incomes, from all sources including self employment
- housing tenure
- caring needs and responsibilities
- disability
- expenditure on housing
- education
- pension participation
- childcare, family circumstances and child maintenance
- household food security and food bank usage
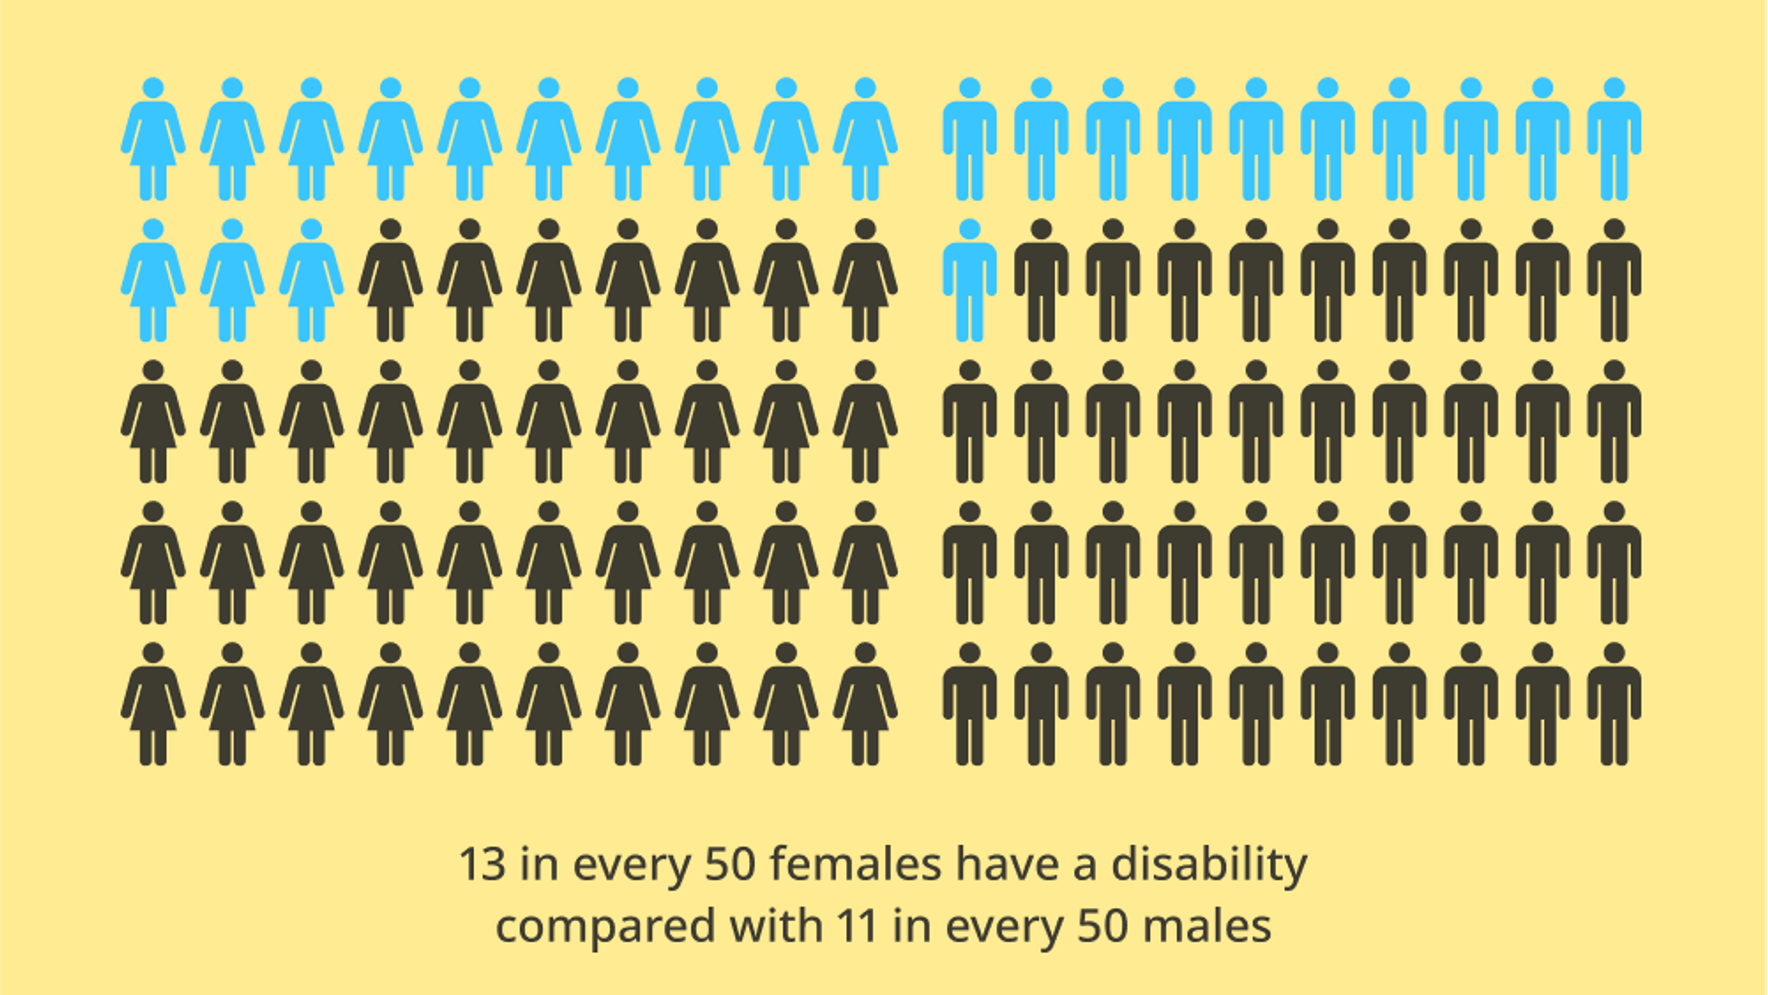
In 2022 to 2023, 24% of people were disabled. A higher proportion of females than males were disabled, 13 in every 50 females compared with 11 in every 50 males.
This means that, statistically, 1 in 4 people you know or meet will have a disability. Now tell them that #Accessibility does not matter.
The results for 2023-2024 will be released in March 2025.
Disability rates on the rise
The number of disabled people in the UK has significantly increased. Between 2012/13 and the most recent survey year, the total rose by 3.9 million, from 12.2 million (19%) to 16.1 million (24%).
- Children: The proportion of disabled children has risen from 7% to 11%.
- Working-age adults: The proportion of disabled working-age adults has increased from 16% to 23%.
- State Pension age adults: The proportion of disabled adults of State Pension age has remained relatively stable between 42% and 46% over the past decade.
Disability rates increasing for both genders
The percentage of both men and women with disabilities in the UK has risen between 2012/13 and 2022/23.
- Women: The proportion of disabled women increased from 21% (6.6 million) to 26% (8.8 million).
- Men: The proportion of disabled men increased from 18% (5.5 million) to 22% (7.2 million).
Gender differences in disability rates
While males aged 14 and under have a slightly higher rate of disability than females of the same age, females in all other age groups have a higher rate of disability than males.

Regional differences in disability rates
The prevalence of disability varies across different regions and countries within the UK.
- Highest: The North East had the highest proportion of disabled people at 31%, seven percentage points above the UK average.
- Lowest: London had the lowest proportion of disabled people at 15%, nine percentage points below the UK average.
Factors influencing regional differences
The differences in disability rates between regions can be partly explained by demographic factors. For instance, the prevalence of disability is higher among older adults, and regions with a larger proportion of older residents may have higher overall disability rates.

Common impairment types by age group
The types of impairments experienced by disabled people vary across different age groups.
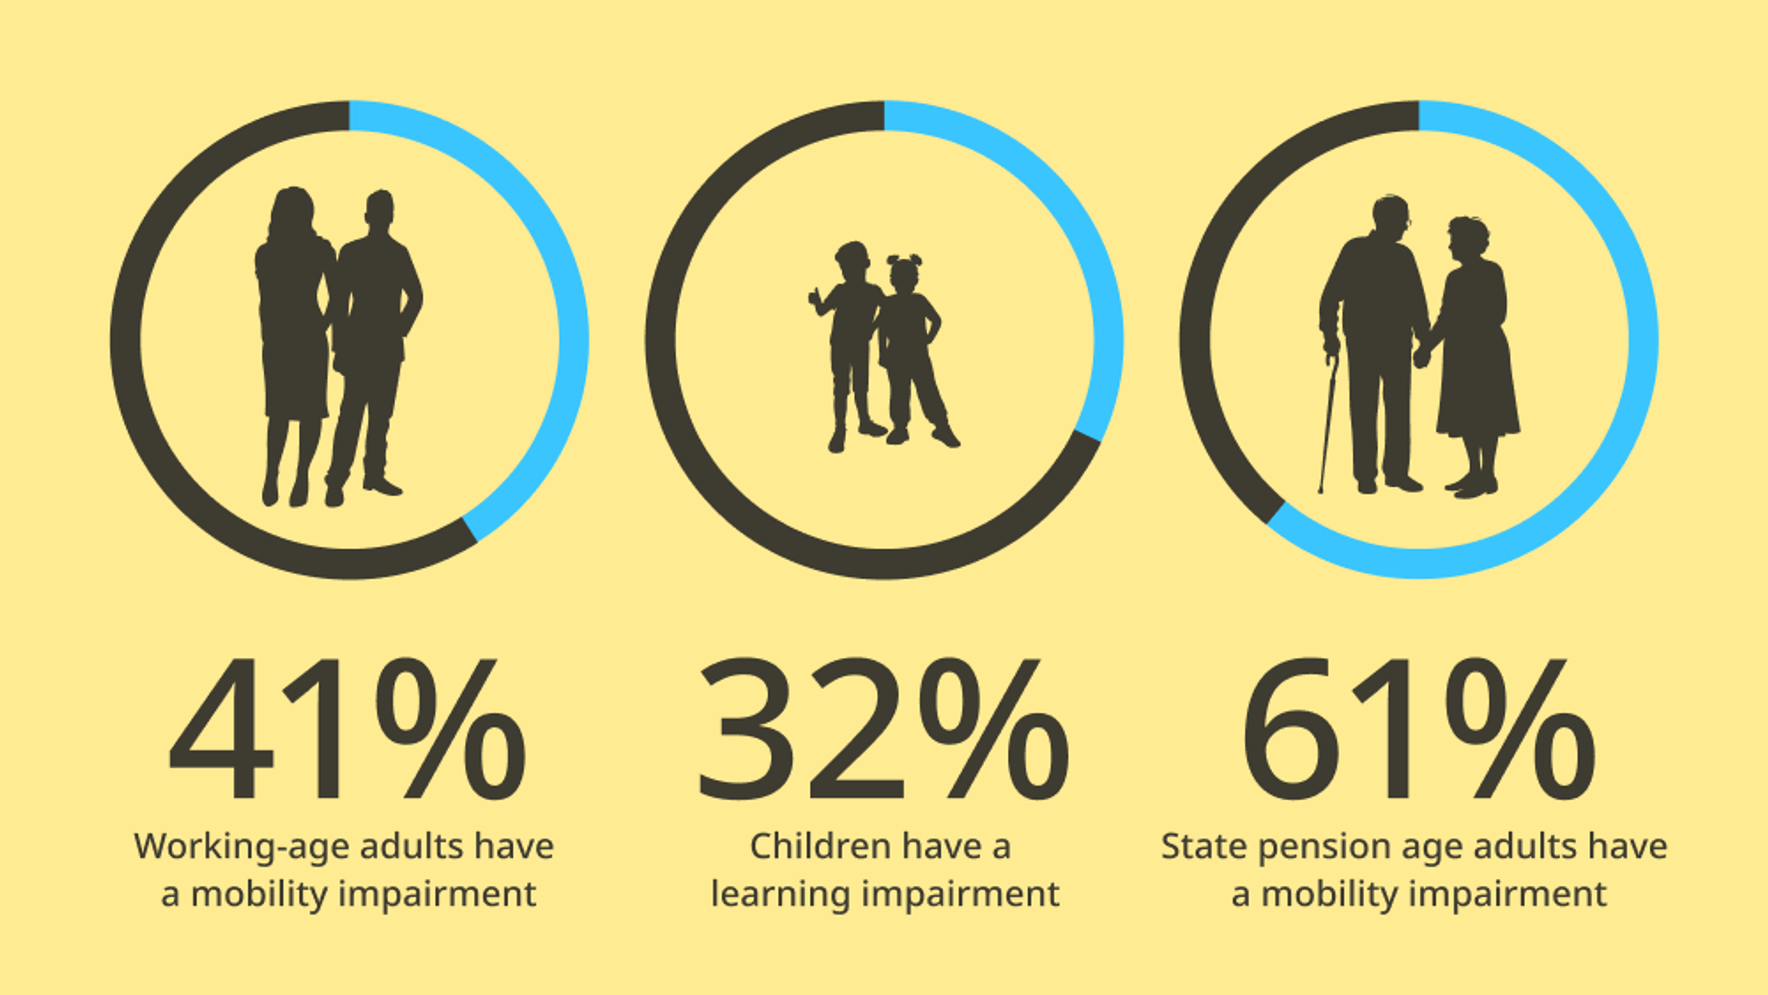
- Children: The most common impairment type for disabled children is social or behavioural impairments (50%), followed by learning impairments (32%) and mental health impairments (30%).
- Working-age adults: Mental health impairments (47%) are the most common for disabled working-age adults, followed by mobility impairments (41%) and stamina, breathing, or fatigue impairments (34%).
- State Pension age adults: Mobility impairments (69%) are the most prevalent type for disabled State Pension age adults, followed by stamina, breathing, or fatigue impairments (46%) and dexterity impairments (33%).
Why accessibility matters
As the number of people with disabilities continues to rise, it's increasingly important to ensure that our physical and digital environments are accessible to all.
The data highlights the significant impact of disability on various age groups:
- Children: 32% of disabled children have learning impairments.
- Working-age adults: 41% of disabled working-age adults have mobility impairments.
- State Pension age adults: 69% of disabled State Pension age adults have mobility impairments, and 33% have dexterity impairments.
Many of these impairments can be addressed through web accessibility standards like WCAG. By making your website accessible, you can ensure that a wider audience, including people with disabilities, can access and use your content.
Failing to prioritise accessibility can lead to significant consequences. If your website is not accessible, you could be excluding up to a quarter of your potential visitors. Food for thought.
Article by Simon Leadbetter
The Accessibility Guy at Kindera
